How Car Maintenance Affects Fuel Economy: The Complete Checklist
Elias Thorne
3/1/202610 min read
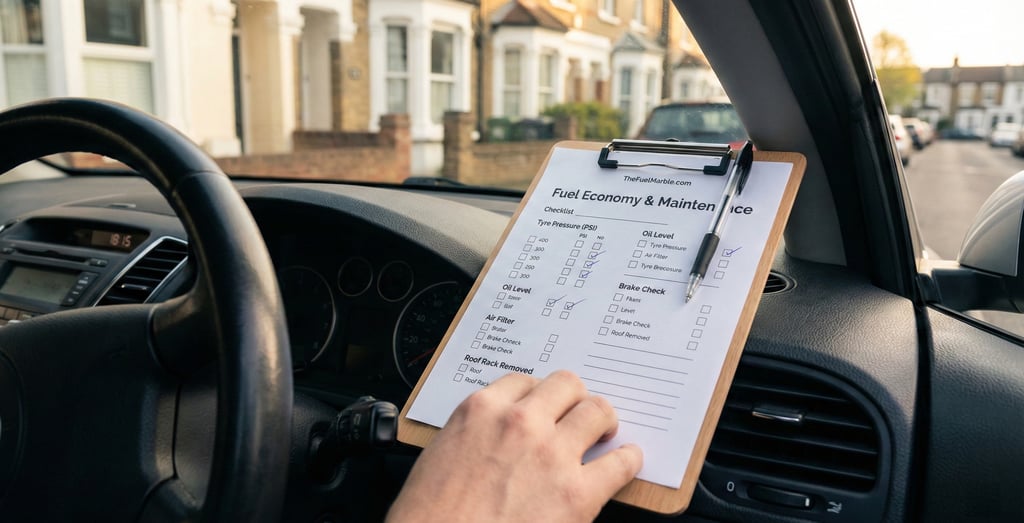

While changing your driving habits is a crucial part of our comprehensive guide to improving fuel economy in 2026, what happens under the bonnet is just as important. Proper vehicle maintenance can cut fuel costs by 10% or more for UK drivers, according to the RAC and Energy Saving Trust — yet over 2 million cars on British roads are overdue for a service.
With petrol averaging around 132p per litre and diesel at 142p in February 2026, even small efficiency gains translate into meaningful savings. This reference document provides verified statistics across 11 maintenance-related fuel economy topics, with source attributions for each claim.
Current UK fuel prices are near their lowest point since 2021
As of late February 2026, UK average unleaded petrol stands at approximately 131.7 – 132.5p per litre, while diesel averages 141.5–141.8p per litre. To stay updated on these market fluctuations and time your fill-ups effectively, checking a live fuel prices tracker is highly recommended. Fuel Finder UK These figures come from PetrolPrices.co.uk (sourcing CMA/gov.uk data, 23 February 2026), heycar's daily tracker (27 February 2026), and Fuel Finder UK's hourly aggregation of 7,235 stations.
Prices drifted steadily lower through 2025, driven by weaker oil prices and global trade uncertainty following April 2025 tariff disruptions that pushed Brent crude to $63.49/barrel. RAC Fuel Watch's year-end 2025 summary records annual averages of 135.69p (petrol) and 142.96p (diesel) — both 6–7p cheaper than 2024. A brief spike in November 2025 saw petrol jump 2.17p and diesel 3.84p, but prices resumed their decline into early 2026. Current UK fuel duty remains frozen at 52.95p per litre until September 2026, with gradual RPI-linked increases planned from April 2027.
For context, a typical 55-litre fill costs roughly £73 for petrol and £79 for diesel. To see exactly how these costs impact your monthly budget based on your specific mileage, use our fuel calculator to run the numbers. HeyCar Supermarket forecourts undercut branded stations by about 5p per litre — a saving of roughly £6 per tank. The government's new Fuel Finder Scheme, launched 9 February 2026, requires retailers to report prices within 30 minutes and is projected to save the average household £40 per year by improving price transparency.
Maintenance improvements to fuel economy: what the data actually shows?
The most widely cited source for maintenance-related fuel economy figures is the US Department of Energy/EPA's fueleconomy.gov, drawing on research by Energy and Environmental Analysis, Inc. (2001, revised 2016). While understanding the data is vital, applying comprehensive fuel saving tips covers not just mechanical fixes, but driving habits that work in tandem with maintenance. These figures are consistently referenced by UK organisations including the RAC, AA, and Energy Saving Trust. Here is what the evidence supports:
Fixing a faulty oxygen sensor: up to 40% improvement. The DOE states that "fixing a serious maintenance problem, such as a faulty oxygen sensor, can improve your gas mileage as much as 40 percent." This represents the extreme worst case — a completely failed sensor forcing the ECU into open-loop mode, where the engine runs excessively rich on pre-programmed fuel maps. Real-world improvements are typically 10–18%. The "up to" qualifier is critical: one documented repair on a 1991 Ford yielded a 15–18% improvement, and similarly, we have seen an 18% fuel efficiency improvement after retrofitting a 2007 Honda Accord, proving that older vehicles often gain the most from targeted interventions. No independent study was found replicating the exact 40% figure, but the mechanism (rich running from lost feedback) is well-established engineering.
General tune-up: 4.1% average improvement. Fueleconomy.gov specifies that "fixing a car that is noticeably out of tune or has failed an emissions test can improve gas mileage by an average of 4.1 percent." This is the baseline for a car with noticeable issues, not perfectly maintained vehicles.
Combined maintenance neglect: up to 10% fuel consumption increase. The RAC states that a car "that isn't properly maintained and serviced can see fuel consumption increase by as much as 10%," a figure also cited by cinch referencing the Energy Saving Trust. Ford's fuel-saving tips page claims combined maintenance operations can improve mileage by up to 25%, citing EPA and FTC sources. The 10% figure represents typical neglect; extreme neglect across multiple systems can push losses higher.
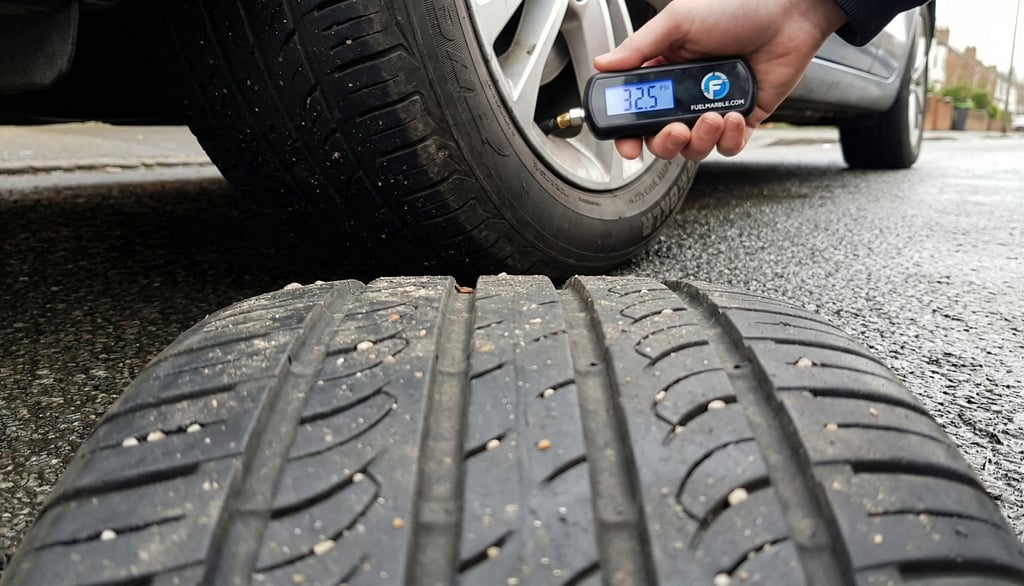
Tyre pressure and the 0.2% per psi claim — verified
The specific claim that "every 1 psi drop equals a 0.2% reduction in fuel economy" is verified. It comes directly from fueleconomy.gov, which states: "Under-inflated tires can lower gas mileage by about 0.2% for every 1 psi drop in the average pressure of all tires." The underlying reference is the Energy and Environmental Analysis, Inc. study. Some sources (notably Schrader TPMS) quote a higher figure of 0.3% per psi, but this appears to be an older or misquoted version — the current authoritative figure is 0.2%.
The broader picture is more compelling. Fueleconomy.gov states that proper tyre inflation improves mileage by 0.6% on average, up to 3%. Oak Ridge National Laboratory's peer-reviewed 2014 study (SAE Paper 2014-01-1614) tested a Toyota Corolla across 40–80 mph and found tyres at 75% of recommended pressure suffered a 2–3% fuel economy penalty, while tyres at 50% pressure saw a 5–10% penalty (worse at lower speeds). At 70 mph specifically, going from recommended to 75% pressure reduced economy from 36.3 to 35.4 mpg — a 2.5% loss.
The UK data is stark. TyreSafe reports that 57% of UK cars have tyres inflated at least 10% below recommended levels — roughly 19 million vehicles. The charity estimates £1 billion in fuel is wasted annually across the UK from underinflated tyres alone. A Nationwide Vehicle Contracts analysis calculated that underinflated tyres during four winter months cost the average petrol car driver an extra £11.60 and diesel drivers £9.80. Proper wheel alignment adds a further up to 2–2.2% improvement (Continental Tyres). Low rolling-resistance tyres rated EU Class A versus Class G can improve economy by up to 9%.
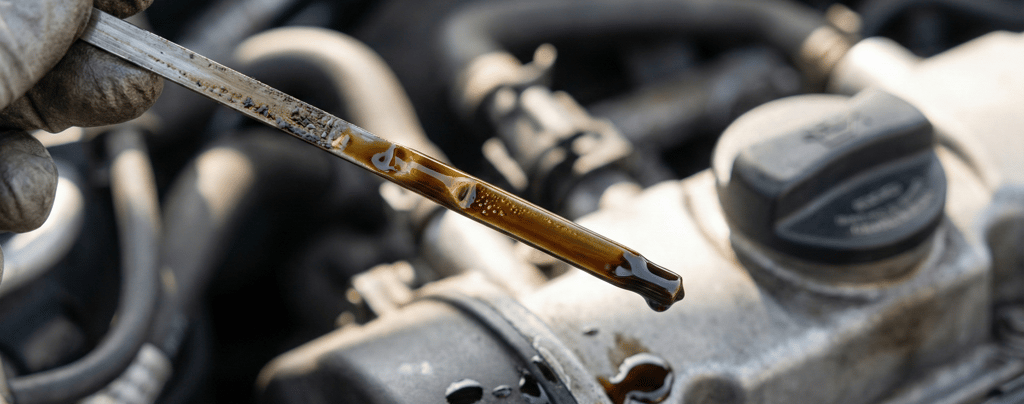
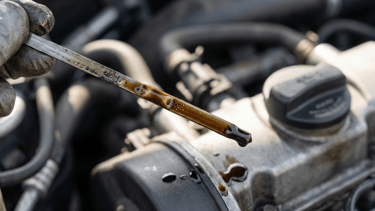
Engine oil viscosity makes a small but verified difference
Using the manufacturer's recommended oil grade improves fuel economy by 1–2%. The site provides specific examples: using 10W-30 in an engine designed for 5W-30 costs 1–2% economy, while using 5W-30 in a 5W-20 engine costs 1–1.5%. The mechanism is straightforward — thicker oil creates more internal friction, forcing the engine to work harder.
Both the AA and RAC emphasise following the owner's manual for correct viscosity. The AA warns that wrong oil can cause "accelerated engine wear and damage to emission control systems like diesel or petrol particulate filters" — particularly relevant for UK diesel vehicles. Look for oils marked "Energy Conserving" on the API symbol, which contain friction-reducing additives. In Europe, ACEA specifications are more commonly referenced than API.
The MOT test is essentially a fuel efficiency check in disguise
No official DVSA statement directly links MOT compliance with fuel economy. However, the MOT emissions test fundamentally measures combustion efficiency — and poor combustion means wasted fuel. For post-1995 petrol cars, the test measures CO (must be ≤0.2% at fast idle), hydrocarbons (≤200 ppm), and lambda (0.97–1.03). High CO means the engine runs rich — literally burning excess fuel. High HC means unburnt fuel is passing through the exhaust, which is why monitoring emission reduction results is often the first step in diagnosing poor fuel economy. A lambda reading below 0.97 directly indicates fuel waste. A peer-reviewed study in the Journal of Environmental Economics and Management confirmed that "better fuel economy is strongly associated with lower emissions of CO and HC, and the effect gets stronger as vehicles age."
DVSA data for Q3 2024–25 shows 28.89% of cars failed their initial MOT test. The most fuel-economy-relevant failure categories include tyres (10.05% of tests failed), brakes (~9%),suspension (10.67%), and emissions (~3.2%). TyreSafe reports over 2 million MOT failures per year from tyre defects alone, with 1 million classified as dangerous. Brakes and tyres together represent 88% of the most serious "dangerous defect" failures (RAC analysis of DVSA data). Poorly maintained vehicles contributed to more than 1,700 road casualties in 2021, including 750 from defective brakes and 491 from defective tyres.
Air filters affect modern and older cars very differently


This distinction matters enormously for accurate blog content. A landmark 2009 Oak Ridge National Laboratory study (ORNL/TM-2009/021, funded by the US DOE, later published as SAE Paper 2012-01-1717) tested multiple vehicles and found a clear split.
Modern fuel-injected cars (2003–2007 models tested): a dirty air filter had negligible effect on fuel economy — the worst case was just 1.7% on one test cycle. However, acceleration suffered by 6–11% (e.g., the 2007 Buick Lucerne's 20–80 mph time slowed from 13.77s to 15.45s, an 11% penalty). The reason is that modern ECUs use oxygen sensors and mass airflow sensors to constantly adjust the fuel-air mixture. Restricted airflow means less power but roughly the same efficiency. Fueleconomy.gov now reflects this: "Replacing a clogged air filter on vehicles with fuel-injected, computer-controlled gasoline engines does not improve fuel economy, but it can improve acceleration."
Older carbureted cars: a dirty air filter reduced fuel economy by 2–6% (the expanded 2012 SAE study). Carbureted engines had no feedback mechanism — less air with the same fuel delivery produced a richer, wasteful mixture. The commonly cited "10–14% reduction" for carbureted cars appears to originate from older, less rigorous sources and likely overstates the effect based on the ORNL data.
Spark plugs, dragging brakes, and roof racks — the supporting evidence
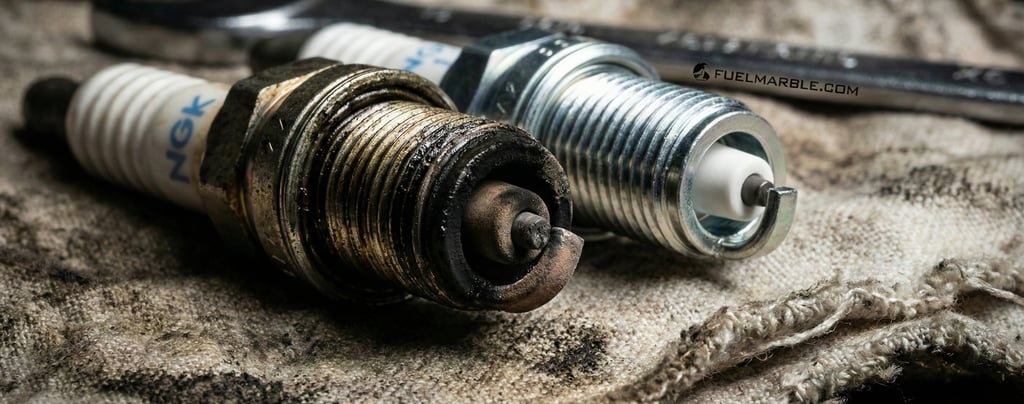

Spark plug misfires: The National Institute for Automotive Service Excellence (ASE), cited by NGK, states that bad spark plugs can decrease fuel economy by up to 30%. This represents an extreme worst case with multiple misfiring cylinders. One source citing SAE International research suggests 12–18% in standard driving conditions, with 30% in severe stop-and-go scenarios. A single misfiring cylinder on a four-cylinder engine theoretically wastes up to 25% of that cylinder's fuel. In practice, modern OBD-II systems detect misfires quickly and trigger warning lights, so chronic 30% losses without driver awareness are unlikely. The DOE's fueleconomy.gov includes spark plugs under general maintenance advice but does not assign a standalone percentage — the 4.1% average tune-up figure incorporates spark plug replacement.
Dragging brake calipers: Rigorous SAE J1321 testing by Bendix at the Transportation Research Center found a 1.5% fuel consumption penalty from a single dragging brake on a commercial vehicle. Shop Owner Magazine, an industry publication, states that moving brake pads back from the rotor by just 1mm can improve fuel economy by 3–5%. Some marketing sources claim 15–20%, but this appears exaggerated for typical cases — though a severely seized caliper could approach such figures alongside obvious symptoms (burning smell, pulling, excessive heat). In the MOT context, binding brakes are tested during the roller brake test; significant effort with the brake unapplied results in a failure, while minor binding gets an advisory.
Roof rack aerodynamic drag: The UK's Vehicle Certification Agency (VCA), a gov.uk source, provides the clearest official figures: a roof box adds approximately 22% to fuel consumption at 62 mph and 39% at 75 mph, while even empty roof bars add around 7% at motorway speeds. The Energy Saving Trust, cited by the RAC, gives slightly different framing: an empty roof rack adds 16% drag at 75 mph, and a roof box adds 39% drag at the same speed. The ORNL 2014 study found a roof cargo box on a compact sedan caused a 22% fuel economy penalty at 60 mph, rising to 25–27% at higher speeds. Crucially, less aerodynamic vehicles (SUVs) suffered smaller percentage penalties (~9% at 60 mph). The aerodynamic drag penalty increases exponentially with speed — minimal at 30 mph, substantial at 70+ mph. All sources agree: remove roof racks and boxes when not in use.
UK tyre tread depth: 1.6mm confirmed, but experts say replace at 3mm
The UK legal minimum tyre tread depth is 1.6mm, confirmed by the Road Vehicles (Construction and Use) Regulations 1986, Regulation 27. The law requires this depth "throughout a continuous band comprising the central three-quarters of the breadth of tread and round the entire outer circumference of the tyre." The penalty for driving on illegal tyres is up to £2,500 and 3 penalty points per tyre — four illegal tyres could mean £10,000 in fines and 12 points (a potential driving ban).
TyreSafe and the RAC both recommend replacing tyres at 3mm rather than waiting for 1.6mm. RAC cites MIRA testing showing the wet braking distance difference between 3mm and 1.6mm can be as much as 44%. TyreSafe's 2023 survey of over 340,000 tyres found 27.3% were illegal at point of replacement, and 70.4% had tread of 2mm or below. The simple "20p test" — inserting a 20p coin into the grooves — provides a quick check: if the outer band is visible, tread is approaching the legal minimum. TyreSafe reports 190 people were killed or seriously injured in tyre-related incidents in 2023, a 29% increase on 2022.
Conclusion
The evidence base for maintenance-related fuel savings is robust, though heavily reliant on a core set of US DOE/EPA studies that UK organisations widely cite. The highest-impact maintenance items for fuel economy are fixing faulty oxygen sensors (10–40% depending on severity), maintaining correct tyre pressure (up to 3%, with £1 billion wasted annually across the UK), removing unused roof accessories (7–39% at motorway speeds), and addressing misfiring spark plugs (potentially 12–30% in severe cases). The commonly cited figures — 0.2% per psi, 1–2% for correct oil, 4.1% for a tune-up — all trace to fueleconomy.gov and hold up under scrutiny, though the "up to" qualifiers deserve emphasis. The most significant UK-specific insight is the scale of the problem: with 57% of cars running underinflated tyres, 2 million vehicles overdue for servicing, and nearly 29% failing MOTs, the aggregate fuel waste across the UK fleet is enormous. For a blog targeting UK drivers, the VCA's roof rack data and TyreSafe's £1 billion underinflation figure are particularly compelling, locally sourced statistics.


Designed to Go Further
Contact
FuelMarble © 2026. All rights reserved.
Delivery
Household
Marine
FuelMarble, 124 City Road, London, EC1V 2NX