
UK Diesel Nears £2: The 30-Day Fleet Action Plan [Updated Sept 2026]
Updated September 2026: This plan was first published during the April 2026 spike, when diesel hit 176p. It has only become more urgent. Diesel now averages 195.5p/L (GOV.UK, week commencing 21 September 2026), driven higher by the shutdown of Saudi Arabia's East-West pipeline after an 11 September drone strike, which has closed the main overland bypass around the Strait of Hormuz. The strategies below matter more now than they did in April.
UK diesel is currently at 195.5p/litre (GOV.UK, week commencing 21 September 2026), track the latest pump price on our live UK fuel price tracker, updated from GOV.UK weekly data. On a 20-vehicle HGV fleet running 80,000 miles a year per truck, that is about £413,686 of unplanned annual cost versus the 150p baseline your budget was built on. This article covers the immediate response to the current spike, the complete guide to cutting diesel costs across a fleet covers the structural picture behind every price event and why conventional levers stop working before the fuel bill does. With winter approaching (cold starts and cab heating naturally worsen fuel economy) getting DPF health (Action 2) and combustion efficiency (Action 4) under control before Q4 cold weather compounds already-record prices is doubly urgent.
UK diesel is averaging 199.5p per litre right now (GOV.UK, week ending 05/10/2026). Petrol is 174.9p.
The calculations in this article are worked at 195.5p per litre, the rate as at September 2026. Diesel is now 2.1% higher than that, so scale the figures below accordingly.
See live UK fuel prices and cost per HGV →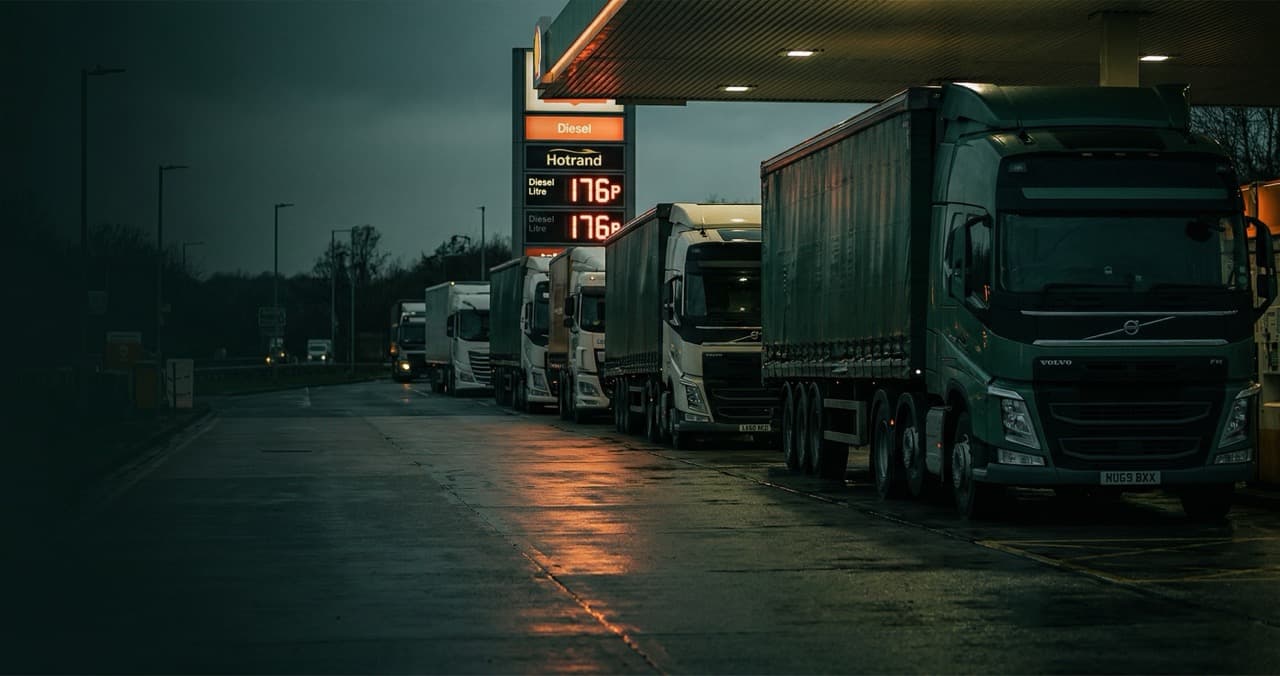
Price Spike Impact Calculator
At +45.5p/litre vs the 150p baseline, a 20-vehicle fleet faces about £413,686 in unplanned annual fuel cost. An 8% combustion efficiency improvement saves £142,199 per year, with hardware paying back in approximately 11 weeks. The purchasing lever has a ceiling. The combustion baseline does not.
| Fleet Size | Annual Litres | Extra Cost vs 150p (+45.5p now) | Extra Cost if £2.10/L (+60p, if shutdown persists) | Annual Save at 8% Efficiency | Annual Save at 12% Efficiency | FuelMarble L ×3/veh Hardware Cost | Weeks to Recover Hardware |
|---|---|---|---|---|---|---|---|
| 5 vehicles | 227,300 L | £103,422/yr | £136,380/yr | £35,550/yr | £53,325/yr | £7,785 | ~11 weeks |
| 10 vehicles | 454,600 L | £206,843/yr | £272,760/yr | £71,099/yr | £106,649/yr | £15,570 | ~11 weeks |
| 20 vehicles | 909,200 L | £413,686/yr | £545,520/yr | £142,199/yr | £213,298/yr | £31,140 | ~11 weeks |
| 40 vehicles | 1,818,400 L | £827,372/yr | £1,091,040/yr | £284,398/yr | £426,597/yr | £62,280 | ~11 weeks |
| 100 vehicles | 4,546,000 L | £2,068,430/yr | £2,727,600/yr | £710,994/yr | £1,066,492/yr | £155,700 | ~11 weeks |
Per vehicle: 80,000 miles/year at 8 MPG (~45,460 litres/year). Your figures will vary, calculate yours · Efficiency savings on full annual consumption at 195.5p/litre · Hardware = 3× FuelMarble L (£1,557) per vehicle for a 44-tonne artic; payback = hardware ÷ annual saving at 8% · Worst-case £2.10/L is a labelled projection if the Saudi East-West pipeline shutdown persists, not the current average · Prices from GOV.UK weekly data
Is This Spike Temporary or Structural?
Both, and in September 2026, more volatile than at any point in years. Brent crude is repricing Strait of Hormuz supply risk, and the 11 September shutdown of Saudi Arabia's East-West pipeline has taken the main overland bypass offline too, which is why prices are pushing toward £2 rather than easing. The geopolitical premium can reverse. The structural floor cannot. Any fleet budget built on a fixed diesel assumption is currently invalid. Budget for a range, not a number.
Honest answer: both, and in September 2026, that combination is more volatile than at any point in years. The immediate trigger was the Iran Crisis, and it has since compounded: on 11 September 2026 a drone strike shut Saudi Arabia's East-West pipeline (the principal overland route bypassing the Strait of Hormuz) expected closed 3–5 weeks (AP). With that backup route down on top of ongoing Hormuz risk, the market is pricing a genuine supply squeeze rather than easing. Brent crude is moving daily. The result is a diesel price that is impossible to budget against using conventional quarterly assumptions.
- Iran Crisis and Hormuz risk (active): roughly 20% of the world's traded oil transits the Strait of Hormuz, any escalation reprices UK pump diesel within 48–72 hours
- Saudi East-West pipeline shutdown (11 September 2026): the principal overland bypass of Hormuz is offline for an expected 3–5 weeks after a drone strike (AP). The backup route is now down too, which is why prices are pushing toward £2 rather than easing
- UK refinery margin compression: crack spreads are structurally wider than pre-2022 levels, so pump price amplifies crude moves faster than it did historically
- Structural floor: even if tensions ease, diesel returning to 150p requires both a crude retracement and a domestic political decision no party has committed to
This applies when your fleet runs on retail ULSD pump diesel. It does NOT apply if you have a fixed-price forward fuel contract covering more than 60% of annual consumption, in which case the geopolitical premium is already hedged and your immediate exposure is limited to the base price movement only.
In March 2024, a 40-vehicle fleet I was advising called an emergency board meeting in week 11 of the financial year. Diesel had moved 25p/litre in 18 days, on roughly 1.8 million litres a year that is about £454,600 of unplanned annual cost materialising from nowhere. The board asked: is this temporary or structural? What can we do in 30 days? And what do we change so this never blindsides us again? This article answers all three, in that order.
The 2026 spike now has a new driver: Saudi Arabia's East-West pipeline (the main overland bypass of the Strait of Hormuz) shut after an 11 September drone strike, expected closed 3–5 weeks (AP). With the backup route down on top of ongoing Hormuz risk, UK pump diesel reached 195.5p/L (GOV.UK, w/c 21 Sept 2026). Any fleet financial model built on a fixed diesel assumption is currently invalid. Budget for a range, not a number.
The reason this spike costs your fleet more than the same price move three years ago is not just the number on the board. It is the compounding combustion inefficiency that has been building in your ageing fleet since the last time prices were this high. Why haulage fuel costs keep rising explains the structural mechanism that makes every spike more expensive than the last.
Action 1: Benchmark Your Consumption Right Now: Before Anything Else
Pull telematics mpg reports per vehicle for the last 90 days. Rank worst to best, the bottom quartile typically carries 60% of all fleet overconsumption. Flag anything more than 20% above fleet average for workshop priority. You cannot act on what you haven't measured. The benchmark comes first.
Every lever you pull in the next 30 days is worthless if you don't know how far your fleet sits from optimal consumption. DVSA benchmarks for 44-tonne artic operation show a national average of approximately 8.2 litres per 100km at 80kph cruise. Most fleets past 50,000 miles are running 9.5–10.8 litres per 100km (15 to 32% above the benchmark) without ever having had a clean comparative number to act against.
- Pull telematics mpg reports per vehicle for the last 90 days
- Convert to L/100km: divide 282.5 by the mpg figure (e.g. 8.5mpg = 33.2 L/100km, that is a serious problem)
- Rank every vehicle worst to best, the bottom quartile typically carries 60% of the overconsumption
- Flag any vehicle more than 20% above fleet average for workshop priority
- Cross-reference against route type. Motorway-heavy routes will always show lower consumption than urban distribution
This applies when you have at least 60 days of telematics data per vehicle. It does NOT apply if your telematics system aggregates fleet-wide rather than per-vehicle, in which case you are flying blind and benchmarking against the total is meaningless. Fix the data first.
Before pulling any lever, benchmark where your fleet actually sits. If you are already running above the industry average, which UK HGV fuel consumption benchmarks shows is the case for most fleets past 50,000 miles. The spike is amplified by that underlying inefficiency on every single litre.
Action 2: Check DPF Health: It Multiplies Every Price Move
A DPF at 60% efficiency forces fuel enrichment to maintain power output. Independent testing across 14 DAF CF and Volvo FM vehicles found an average 6.1% fuel consumption increase from DPF degradation, about £54,213 per year on a 10-vehicle fleet at current prices. At 195.5p/litre, this is the most expensive that multiplier has ever been.
A partially blocked DPF is a fuel tax your fleet is paying on top of the pump price, and at 195.5p/litre, that multiplier is the most expensive it has ever been. A DPF operating at 60% efficiency forces the engine management system to enrich the fuel mixture to maintain power output. Independent testing across 14 DAF CF and Volvo FM vehicles showed DPF degradation accounts for an average 6.1% increase in fuel consumption, invisible in normal operations, but adding approximately £54,213 per year to a 10-vehicle fleet at current prices.
- Run a DPF diagnostic scan on every vehicle in the bottom quartile of your consumption ranking from Action 1
- Check soot loading percentage, anything above 45% warrants action before the next long-distance run
- Check ash accumulation. This does not clear with passive or active regeneration; it requires physical cleaning
- Flag vehicles with recurring DPF warning codes. The fault is upstream (incomplete combustion), not in the filter itself
- Schedule forced regeneration cycles on any vehicle showing soot above 35% before the next fill
This applies when your fleet runs vehicles over 3 years old or past 150,000 miles. It does NOT apply to vehicles under 2 years old with full manufacturer service history, where DPF degradation is unlikely to be a meaningful contributor.
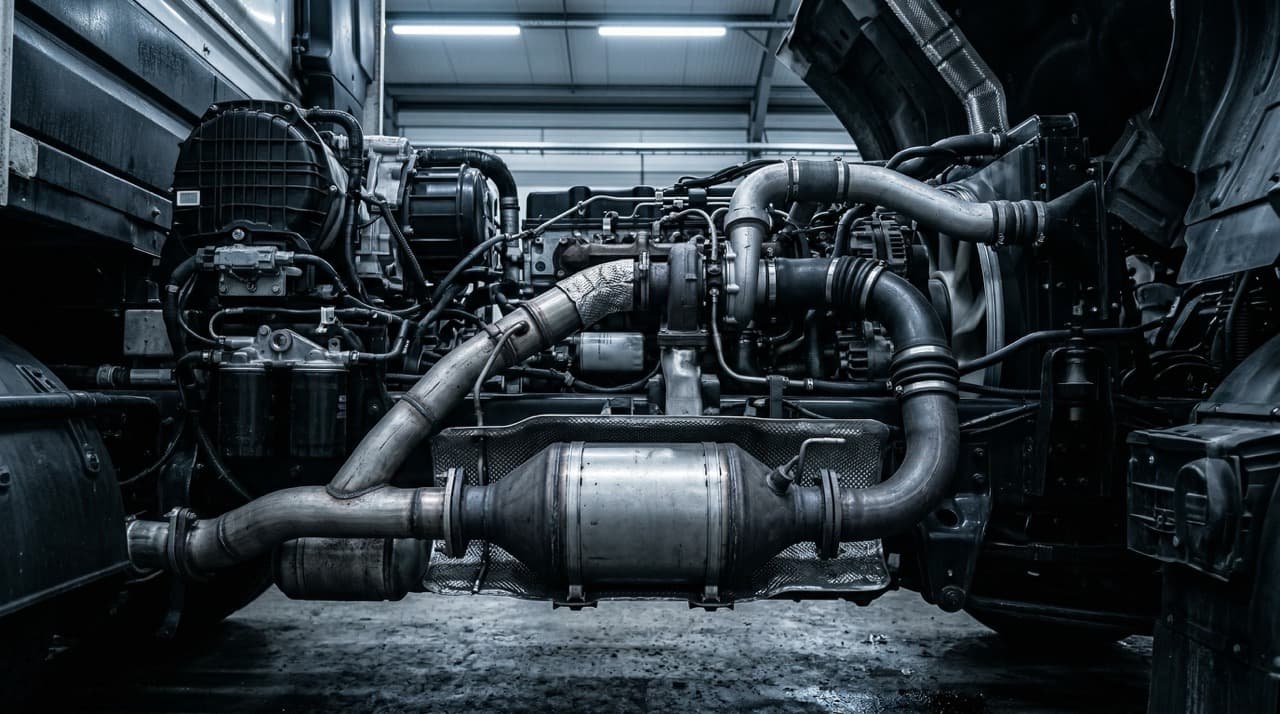
A DPF cleaned once without addressing the combustion root cause will re-block at the same rate. The filter is not the problem. Incomplete combustion is. Cleaning a DPF without addressing combustion efficiency is a cost, not a fix.
Action 3: Audit Your Fuel Card Contract This Week: Know the Ceiling Before You Hit It
The average UK fleet fuel card discount runs 2.8–6.2p/litre. Maximising to 6p closes only about 13% of the gap back to your 150p budget baseline. That is meaningful, but it is also the ceiling. A single renegotiation call typically returns £8,000–£22,000 annually for a 20–40 vehicle fleet.
Renegotiating your fuel card terms is the fastest lever you can pull in 30 days, but it has a hard ceiling, and most fleets don't know where that ceiling is. The average UK fleet fuel card discount on ULSD runs between 2.8p and 6.2p per litre depending on volume, card provider, and contract vintage. At 195.5p/litre, maximising that discount to 6p closes roughly 13% of the gap back to your 150p budget baseline. That is meaningful, but it does not get you home.
- Request a contract review call with your fuel card provider within 5 working days. Providers will negotiate proactively on volume accounts above 150,000 litres/year
- Check your current discount against the RAC Fuel Watch and GOV.UK weekly pricing data, if your effective rate is within 2p of pump price your contract is underperforming
- Review card acceptance network breadth. A cheaper discount is worthless if it restricts your drivers to out-of-route stops that add 30 minutes per fill cycle
- Ask specifically about bunkering options if your depot footprint justifies a fixed storage tank. Bunkered diesel typically runs 8–14p/litre below pump at current wholesale spread
- For multi-vehicle fleets above 40 units, request a forward price strip for Q4 2026 and Q1 2027, locking a portion at today's level provides a hedge against continued volatility while the pipeline is down
This applies when your fuel card contract is more than 18 months old or was signed before the current price environment. It does NOT apply if you are already on a bespoke volume deal signed in the last 6 months with a discount above 5p/litre.
A single hour spent on this call typically returns £8,000–£22,000 annually for a 20–40 vehicle fleet. That is not the solution, but it funds the time to implement the structural fixes below.
Action 4: Address Combustion Efficiency Before the Next Fill
This is the only action on this list that operates on every future litre regardless of what price does next. At 195.5p/litre, an 8% combustion efficiency improvement on a 20-vehicle fleet saves £142,199 per year. A 12% improvement saves £213,298. Neither requires route changes, fleet replacement, or repeat purchases.
This is the only action on this list that operates on every future litre regardless of what price does next. The first three actions above are purchasing and maintenance levers, they reduce what you pay or recover waste in existing systems. Action 4 addresses the combustion baseline: the percentage of each litre that actually converts to forward motion. On the average UK HGV fleet, that figure is 8–14% below optimum. Recovering even half of that gap permanently changes the economics of every price spike that follows.
- Actions 1–3 should be completed first, they give you the baseline data and quick savings that fund structural investment
- Identify which vehicles in your bottom-consumption quartile have no outstanding mechanical faults. These are the candidates for combustion efficiency intervention
- A single vehicle trial across one full duty cycle (typically 2–4 weeks for an HGV) generates the before/after L/100km data needed to justify fleet-wide rollout internally
- Document pre-intervention consumption from telematics, not from driver estimates. The data must be defensible to a finance director
- Present the result as cost-per-mile before and after (not mpg, not percentage points) because cost-per-mile is the number a board will act on
This applies when vehicles have passed the diagnostic checks in Actions 1–3 and have no active fault codes. It does NOT apply to vehicles with unresolved DPF, injector, or turbo faults, where the efficiency intervention cannot achieve its baseline result until those faults are resolved.
At 195.5p/litre, an 8% combustion efficiency improvement on a 20-vehicle fleet saves £142,199 per year. A 12% improvement saves £213,298. Neither requires route changes, fleet replacement, or repeat purchases.
The four actions above work. Benchmark, check the DPF, renegotiate the card, and trial a combustion intervention, and you will see measurable reductions within 60 days. That is the immediate response to 195.5p diesel.
But here is what the P&L reveals that the action plan doesn't say aloud: fleet operators responding to a price spike instinctively reach for purchasing levers, renegotiating fuel card rates, switching suppliers, shopping forecourts. All of those address the price paid per litre. None of them touches the number of litres the engine burns per mile. At 195.5p/litre, a fleet running 8% above optimal combustion efficiency is paying 195.5p for every litre, including the 8% that never converted to forward motion. That inefficiency cost was buried and invisible at 150p/litre. At 195.5p it is suddenly £142,199 per year on a 20-vehicle fleet that nobody budgeted for. The purchasing lever ceiling is real and fixed. The combustion baseline is not.
FuelMarble's permanent combustion efficiency improvement is the only intervention on this list that operates on every future litre regardless of what diesel does next, without route modification, fleet replacement, or repeat purchase cost. One hardware installation per vehicle, one-time cost, permanent efficiency shift on every engine cycle from the day it goes in.
See FuelMarble L for HGV Fleets →What Comes After the 30-Day Plan?
The 30-day plan covers the immediate crisis. Benchmark, DPF, fuel card, combustion trial, measurable reductions within 60 days. The pipeline will reopen and tensions will eventually ease. The structural floor will not. The question is not how to survive this spike. It is how to stop the next one blindsiding the board.
The actions above handle the immediate response. Benchmark now, fix the DPF, renegotiate the card, and trial a combustion intervention before the next fill cycle. That addresses what you can control in the next 30 days.
The supply shock is not resolving quickly, the Saudi East-West pipeline is out for an expected 3–5 weeks (AP), on top of ongoing Hormuz risk, and Brent crude is moving daily. The structural question is not how to respond to this spike. It is how to stop every future spike blindsiding the board the same way. Whether your fleet fuel spend is broken at the source shows why most fleets keep returning to these conversations every time prices move, and what fixes it permanently.
Avery leads FuelMarble's international operations and strategic direction. With a background spanning fleet economics, regulatory compliance, and macro fuel market trends, Avery oversees commercial partnerships, product positioning, and the company's growth across the UK, US, Canadian, and Mexican markets.
Ready to Improve Your Fuel Efficiency?
FuelMarble delivers up to 15% fuel efficiency improvement. Simple drop-in install.