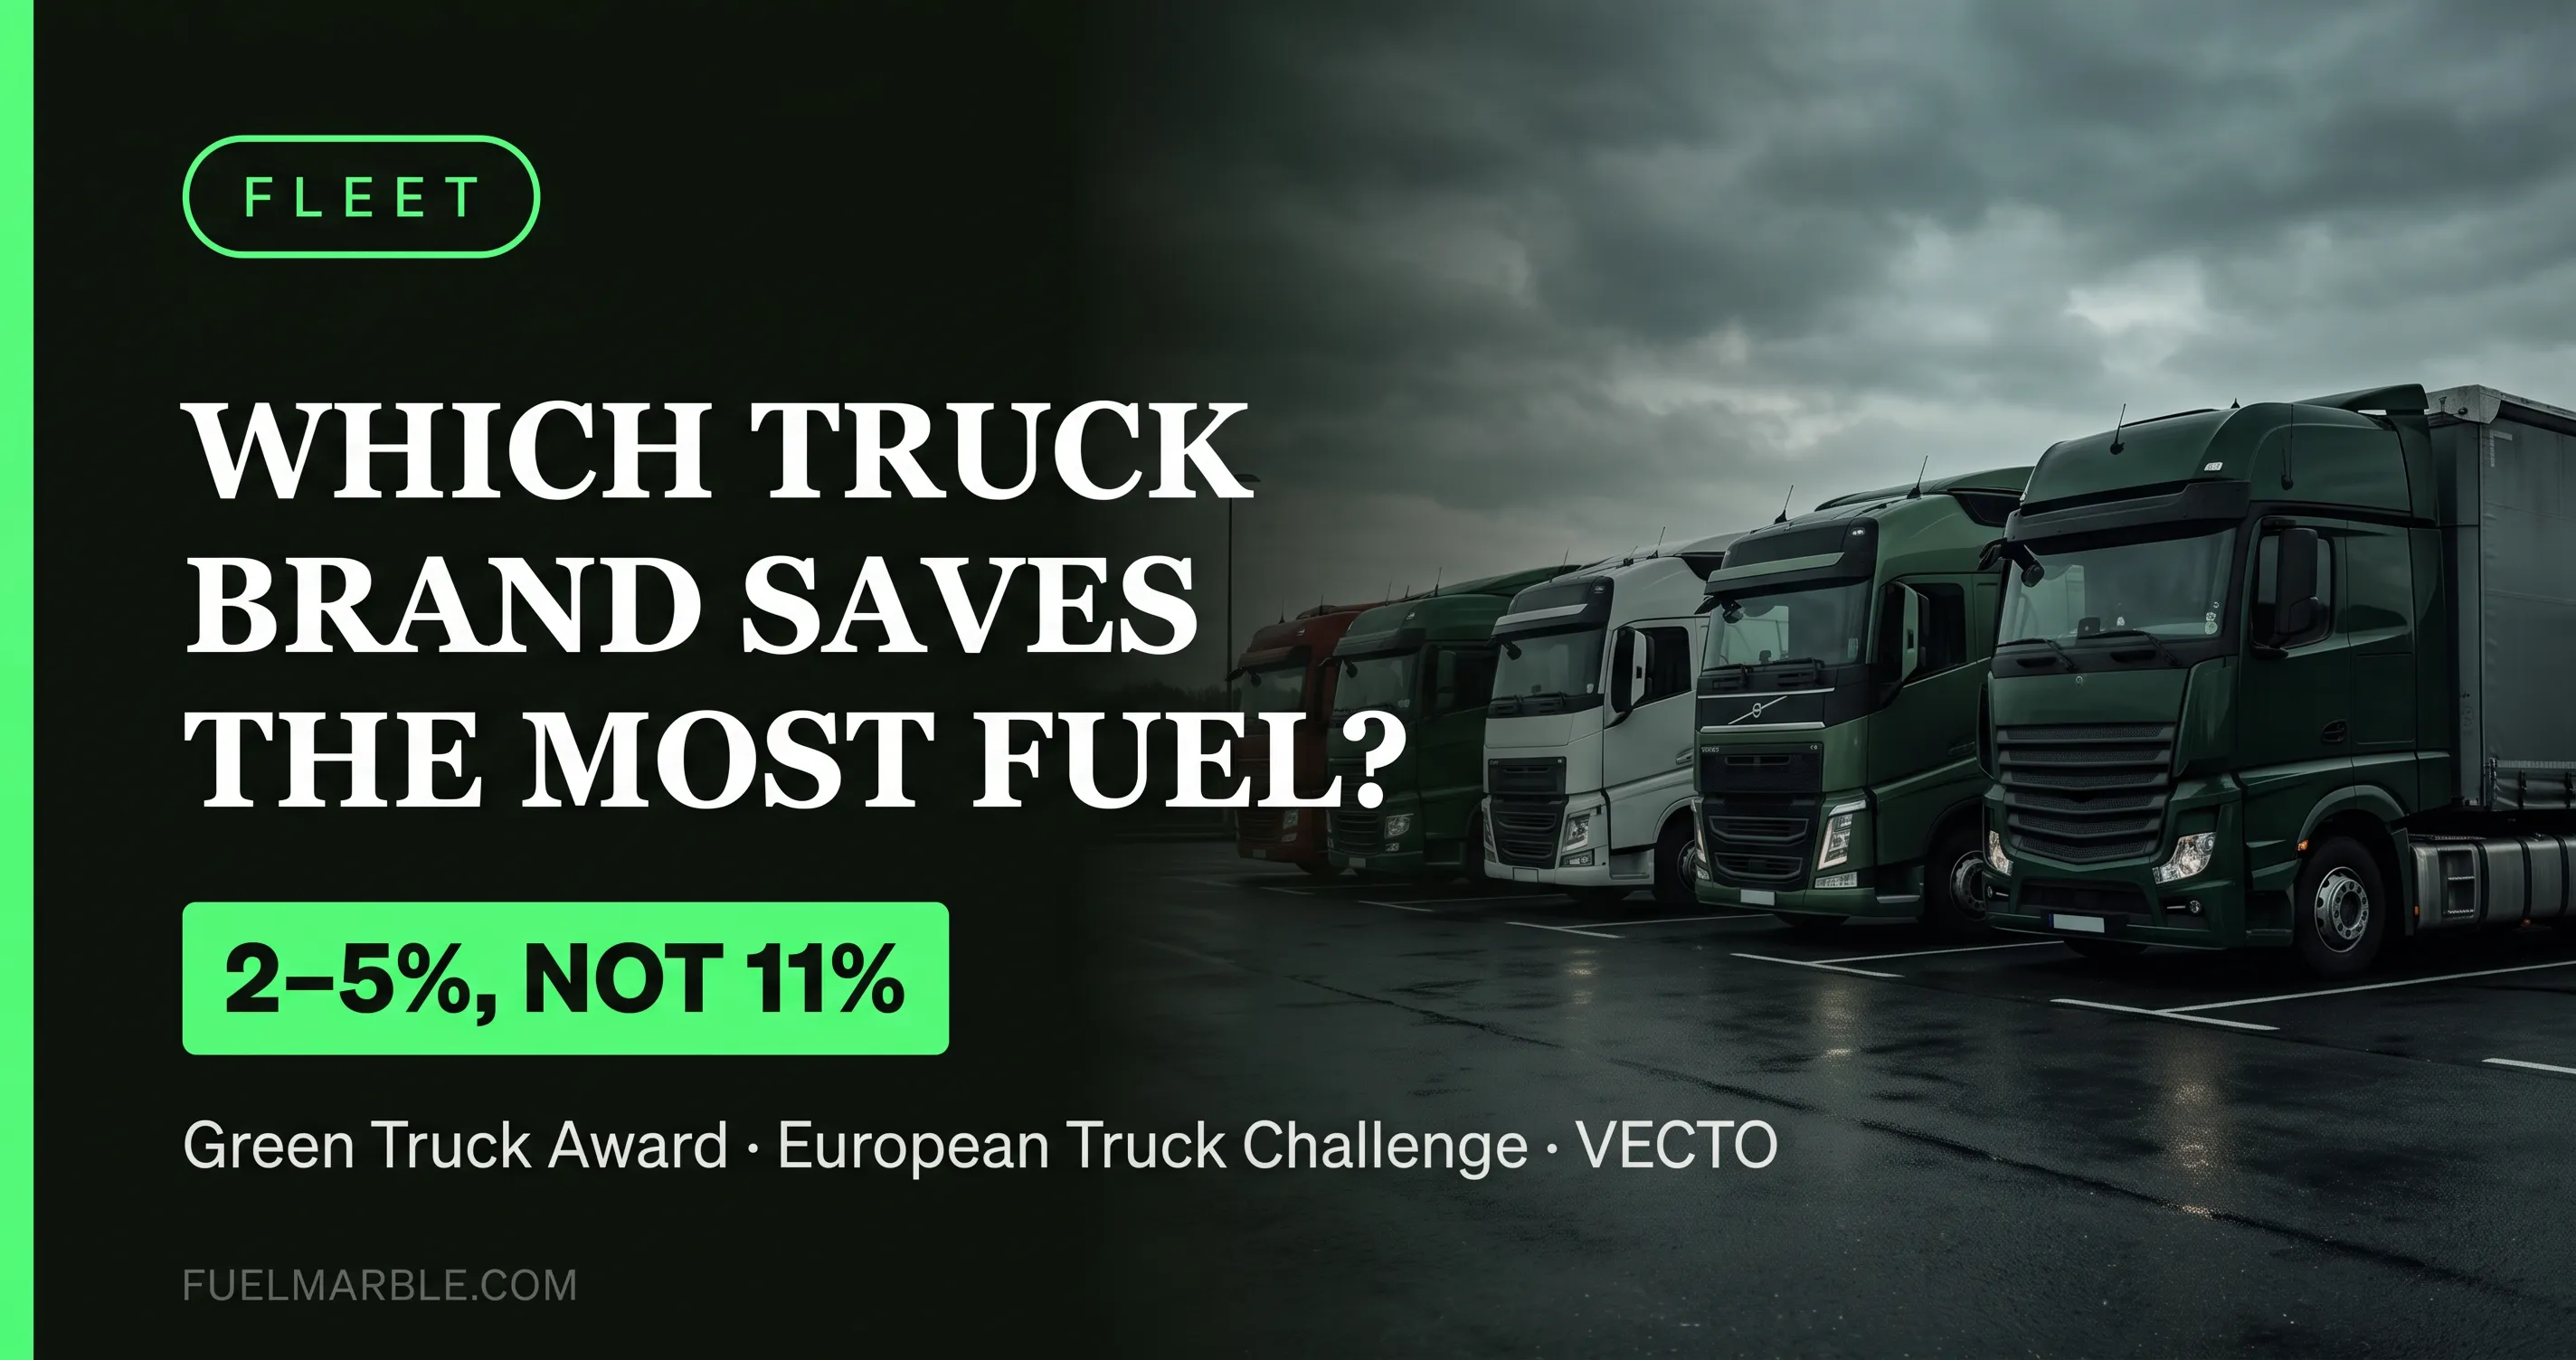
Which Truck Brand Is Most Fuel-Efficient — and Is It Worth Replacing Your Fleet to Get It?
No single truck brand holds a lasting fuel-efficiency lead, and the real gap between the best and worst Euro VI tractors is far too small to justify replacing a fleet to chase it. If you run diesel spend across a fleet, fleet fuel efficiency comes down to a handful of levers — and the badge on the cab is one of the weakest. This article does two things. First, it answers honestly which brand actually wins on fuel. Then it shows why the real money question is not which truck to buy — it is what you can add to the trucks you already run.
Which Euro VI Truck Brand Is Actually the Most Fuel-Efficient?
No brand owns the top spot. Independent road tests rotate the winner year to year, and the measured gap between the leaders is small. "Most fuel-efficient brand" is a moving target, not a fixed fact you can bank a purchase on.
Recent Green Truck Award winners tell the story:
- 2022 — Scania 500 S Super took the title.
- 2023 — DAF XF broke Scania's run.
- 2024 — Scania R 460 Super won it back.
- 2025 — Volvo FH Aero led the field, all three trucks under 22 L/100km.
Across matched independent tests, the real best-to-worst spread lands at roughly 2–5%.
In the 2024 Green Truck test, the winning Scania beat the runner-up by just 0.41 L/100km. Over a year of running that is real money — but it is about 1.7%, not the double-digit lead marketing materials imply.
Why Is the Brand Gap So Much Smaller Than the Comparison Graphic Says?
OEM comparison graphics show best-case simulation values from a single manufacturer. Independent tests on real routes, matched loads, and multiple drivers collapse the gap to roughly 2–5%. The core physics of a diesel engine is nearly identical across every badge.
Four reasons the real gap is small:
- Every Euro VI diesel hits the same thermodynamic ceiling — around 55–60% of each litre still leaves as waste heat.
- Official VECTO figures run about 11% below real-world consumption, so simulation numbers flatter every brand unequally.
- Trailer specification — aerodynamics, tyres, axle loading — often moves total fuel more than the tractor does.
- Rankings reshuffle by route: a truck tuned for flat motorway loses ground on hilly regional runs.
In the European Truck Challenge, a MAN TGX recorded 28.1 L/100km against a Scania's 28.0 — a dead heat. And when the ICCT compared official VECTO numbers to the same trucks on the road, real consumption ran about 11% higher than the paperwork claimed.
Is It Worth Replacing Your Fleet to Chase a 10% Fuel Saving?
The numbers for a 44-tonne artic, running 120,000 km a year:
- Baseline fuel: ~34 L/100km (about 8.3 MPG) = £63,240 per truck per year at current prices.
- Best-case 4% brand switch: about £2,530 saved per truck per year.
- A 20-truck fleet: about £50,600 saved per year.
- New tractors to bank that: about £2.82M in capital.
- Payback on fuel alone: 40 to 56 years.
Replace 20 tractors at the RHA 2026 list price of £141,108 each and you spend £2.82M to save about £50,600 a year on fuel. That is over half a century to break even on the fuel line.
Diesel price note: figures use an effective fleet cost of £1.55/litre ex-VAT, derived from the RAC pump price of 192.86p/litre on 17 September 2026 — its highest since 2022. Diesel moved roughly 12p in a single month this autumn. Bulk buyers pay less than pump. Treat every fuel figure here as a dated snapshot, not a fixed rate, and rerun your own numbers against your fuel-card rate.
In my experience, this is exactly where fleet replacement reviews go wrong. I sat in one where the board was ready to sign off nearly £3M of new tractors to chase an 11% number lifted straight from a manufacturer's fuel graphic. We pulled three years of telematics before anyone signed. The gap between our brands, on matched routes, was under 3%. The gap between our best and worst drivers — on the same trucks — was almost 16%. The capital went into a driver programme and efficiency hardware instead of steel. The fuel line moved more, faster, and we kept the trucks.
What Actually Moves Fleet Fuel Economy More Than Brand Choice?
Ranked by typical impact:
- Driver behaviour — 15–30% between the best and worst driver on the same truck and route (US Department of Energy / Oak Ridge data).
- Motorway speed — dropping 56 mph to 50 mph cuts consumption by around 20%.
- Tyres — every 10% of under-inflation adds about 2%; low-rolling-resistance drive tyres save more.
- Combustion completeness — 7–15% is addable, and it is identical across every badge in the comparison.
On one fleet running the same tractor on the same route, the worst driver burned about 16% more fuel than the best. That single gap is three times the entire brand-to-brand spread — and it closes in 60 to 90 days with a scorecard and coaching, at zero capital cost.
Once you accept the truck is not the lever, the next question every fleet manager asks is whether the bolt-on efficiency products actually deliver. That is worth a straight answer before you spend anything, so it is worth knowing whether fuel-saving devices for trucks actually work — which ones have verified data behind them, and which are garage-shelf claims — before the next line item hits your budget.
How Do You Add Fuel Efficiency to the Truck You Already Own?
The add stack, in order of ease:
- Driver scorecards and coaching — first, because it is free and fast.
- Speed-limiter policy and route optimisation.
- Low-rolling-resistance tyres and weekly inflation checks.
- A coolant-side combustion device — FuelMarble's verified range is 7–15%.
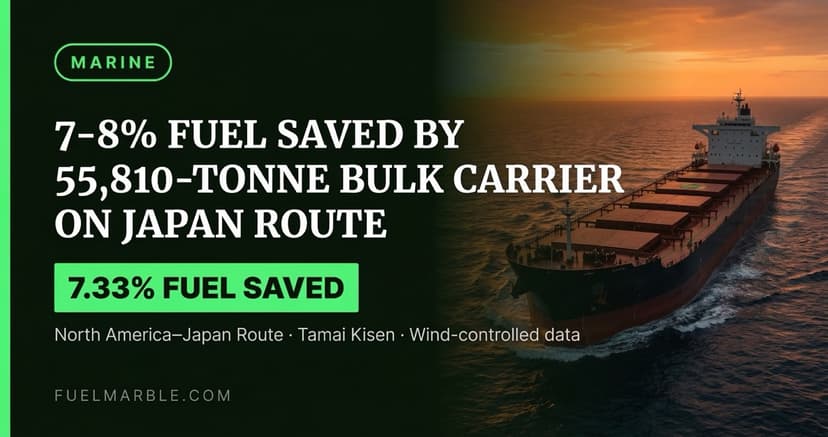
FuelMarble's precision mineral device sits in the engine's freshwater cooling circuit. It lowers coolant surface tension, which improves heat transfer, drops cylinder-wall temperature, raises intake charge density, and burns more of each injection. It is not a fuel additive — it never touches the fuel, DPF, or emissions hardware. The verified results span vehicle types: 15.90% on an Isuzu Gala highway coach with Yamanashi Kotsu, 7.33–8.31% on the Tres Felices bulk carrier with Tamai Steamship, and 5.9% on an MLIT-validated ferry. Same mechanism, any liquid-cooled diesel.
The lever every fleet review misses
Getting the brand comparison right is the correct first move. You have just saved yourself from spending nearly £3M to chase a few percent. Specifying the right truck at replacement, coaching your drivers, managing your tyres — all of it works, and all of it is worth doing.
But notice what every one of those levers has in common. They treat fuel efficiency as something you either buy with the truck or bolt on around it — while the single biggest loss sits inside the engine, where 55–60% of every litre of diesel leaves as waste heat before it turns a wheel. That is not a brand problem or a driver problem. It is the assumption that a truck's efficiency is fixed the day you sign for it.
That assumption is exactly what FuelMarble is built to break — by adding combustion efficiency to the truck you already own. Its coolant-side mineral device targets combustion completeness at the source, recovering a verified 7–15% on the fleet already on the road — around £1,557 a truck for a 44-tonne artic (3× FuelMarble L, per the over-13-tonne sizing), with no new capital and no waiting for the next replacement cycle.
Add vs Replace: 20-Truck Fleet, One Year
44t artic · 120,000 km/yr · ~34 L/100km baseline
| Metric | Replace with best-in-class brand | Add FuelMarble to existing fleet |
|---|---|---|
| Fuel efficiency gain | ~4% (best case of a 2–5% real gap) | 7–15% verified (10% modelled) |
| Fuel saving / year | ~£50,600 | ~£126,500 |
| Capital cost | ~£2.82M | £31,140 one-time |
| Payback on fuel alone | 40–56 years | Weeks |
| Depends on the badge? | Yes — locked at purchase | No — any liquid-cooled diesel |
Modelled at £1.55/litre ex-VAT (from RAC pump price 192.86p, 17 Sep 2026), FuelMarble L £519/unit × 3 units per 44-tonne artic, RHA 2026 tractor list £141,108. Brand-switch saving at 4% (top of the verified 2–5% independent-test range); FuelMarble at 10% (mid of the 7–15% verified range). Diesel prices are volatile — rerun against your own fuel-card rate. Directional planning figures, not a fleet quote.
See the verified fleet results behind the 7–15% range, or size a unit for your vehicles on the FuelMarble L product page.
Avery leads FuelMarble's international operations and strategic direction. With a background spanning fleet economics, regulatory compliance, and macro fuel market trends, Avery oversees commercial partnerships, product positioning, and the company's growth across the UK, US, Canadian, and Mexican markets.
Related Articles

Ready to Improve Your Fuel Efficiency?
FuelMarble delivers up to 15% fuel efficiency improvement. Simple drop-in install.